Weather Preview
Overview
In this tutorial, we will use Motion Canvas to integrate real-time data from a weather API into our animations. Building on your knowledge of REST API fundamentals, we’ll focus on fetching weather data, processing it for specific attributes like temperature and conditions, and dynamically visualizing this data. This hands-on approach will demonstrate how to transform raw JSON responses into compelling animations that adapt to real-world weather changes. Let’s dive in and bring your animations to life with live weather data!
Output Video
Tutorial Video
Prerequisites
- Node.js installed
- Version
v20.17.0was used during this tutorial - A guide on Node.js is coming in the future
- Version
- Your favorite IDE
- VS Code was used in this tutorial
- Completion of the Motion Canvas Rest API project
Useful Links
Tutorial
- Create a new Motion Canvas Project using the following command and inputs when prompted
npm init @motion-canvas@latest- Project name:
weather - Project path:
weather - Languages:
TypeScript (Recommended) - How would you like to render your animation?
Image Sequence&Video (FFmpeg)
- Project name:
- Now let's move into the new directory, install the dependencies, and start the web viewer
cd weathernpm installnpm start- In the video, the command
code .is a shortcut from VS Code.
- In the video, the command
- Rename the project
- In
./src/project.tsrenameexampleto beweatherimport {makeProject} from '@motion-canvas/core';
import weather from './scenes/weather?scene';
export default makeProject({
scenes: [weather],
}); - Rename the file
./src/scenes/example.tsxto./src/scenes/weather.tsx
- In
- Change the background
- In the UI Viewer, under
Video Settings, change the background to bewhite(drag the color selector to the top left conner) and the alpha layer to1 - The UI Viewer should show
rgb(255,255,255)
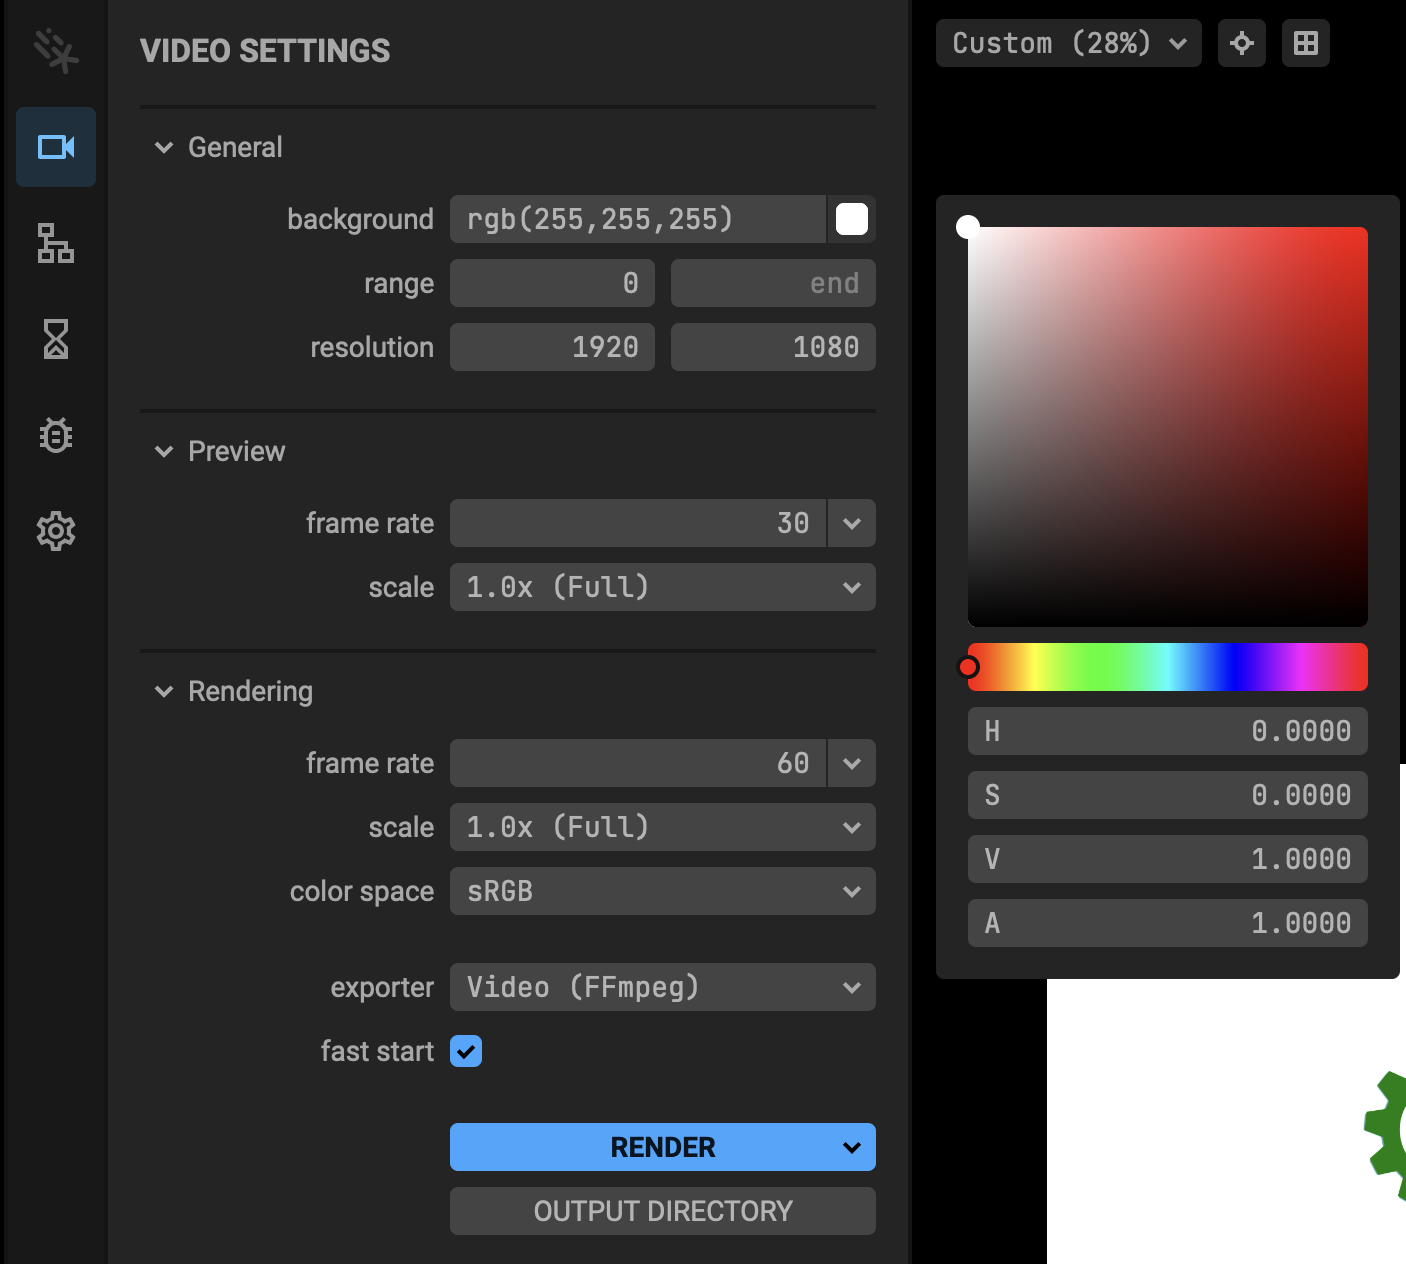
- In the UI Viewer, under
The rest of this tutorial will happen in our ./src/scenes/weather.tsx file.
-
Create a
CodeBlock-
Update the 1st line to be
import {Code, makeScene2D} from '@motion-canvas/2d';as this will remove the default settings and let us use theCodeBlock in our animation. -
Remove the 2nd line for
@motion-canvas/coreas we will not need to make a reference at this time. -
Update the body of
makeScene2Dto just contain a template for our code.view.add(<Code
fontSize={15}
code={"Hello World"}
fill={"black"}
/>);- This will let us make sure everything is working first.
NoteIt is a good practice to test your code often and in small steps while writing.
-
-
Getting Weather Data
- Now it is time to get weather data from online. The way we do this is by a REST API. One good source for weather data is Open-Meteo which can be used for free for our purpose.
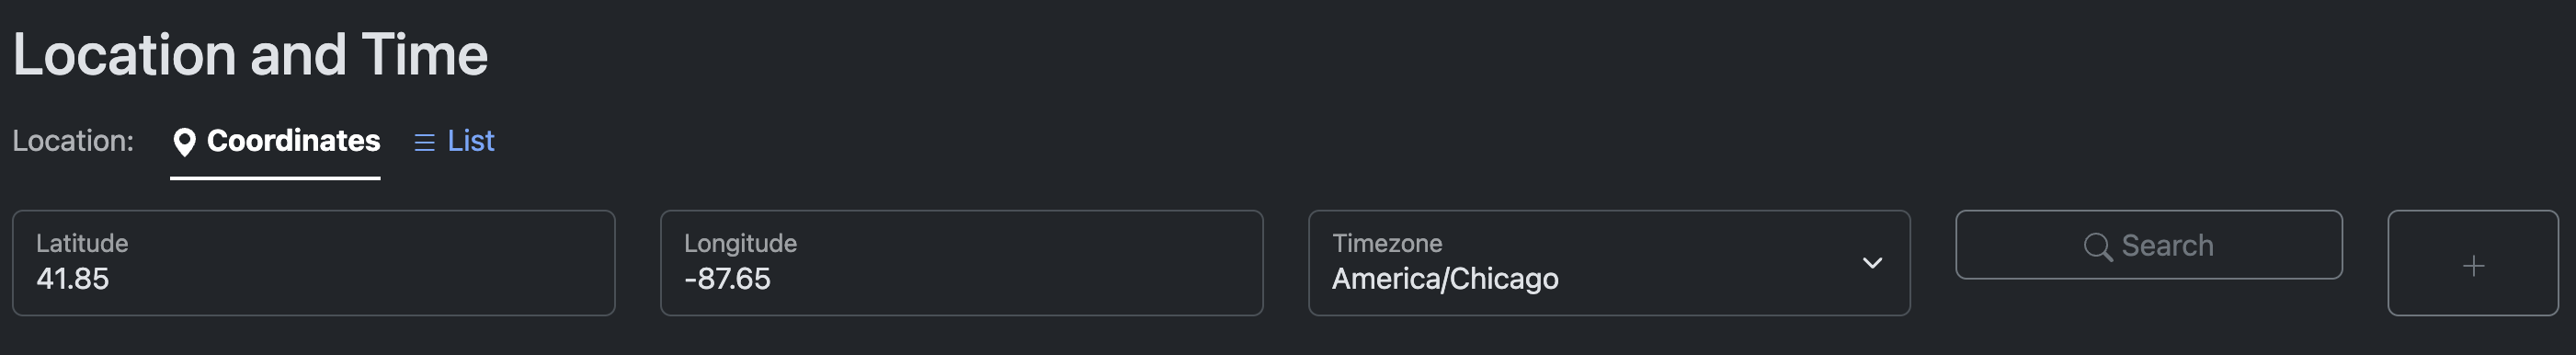
- With this site, there is a selector to help make the API that we will use.
- Select the Latitude and Longitude that you want including the Timezone.
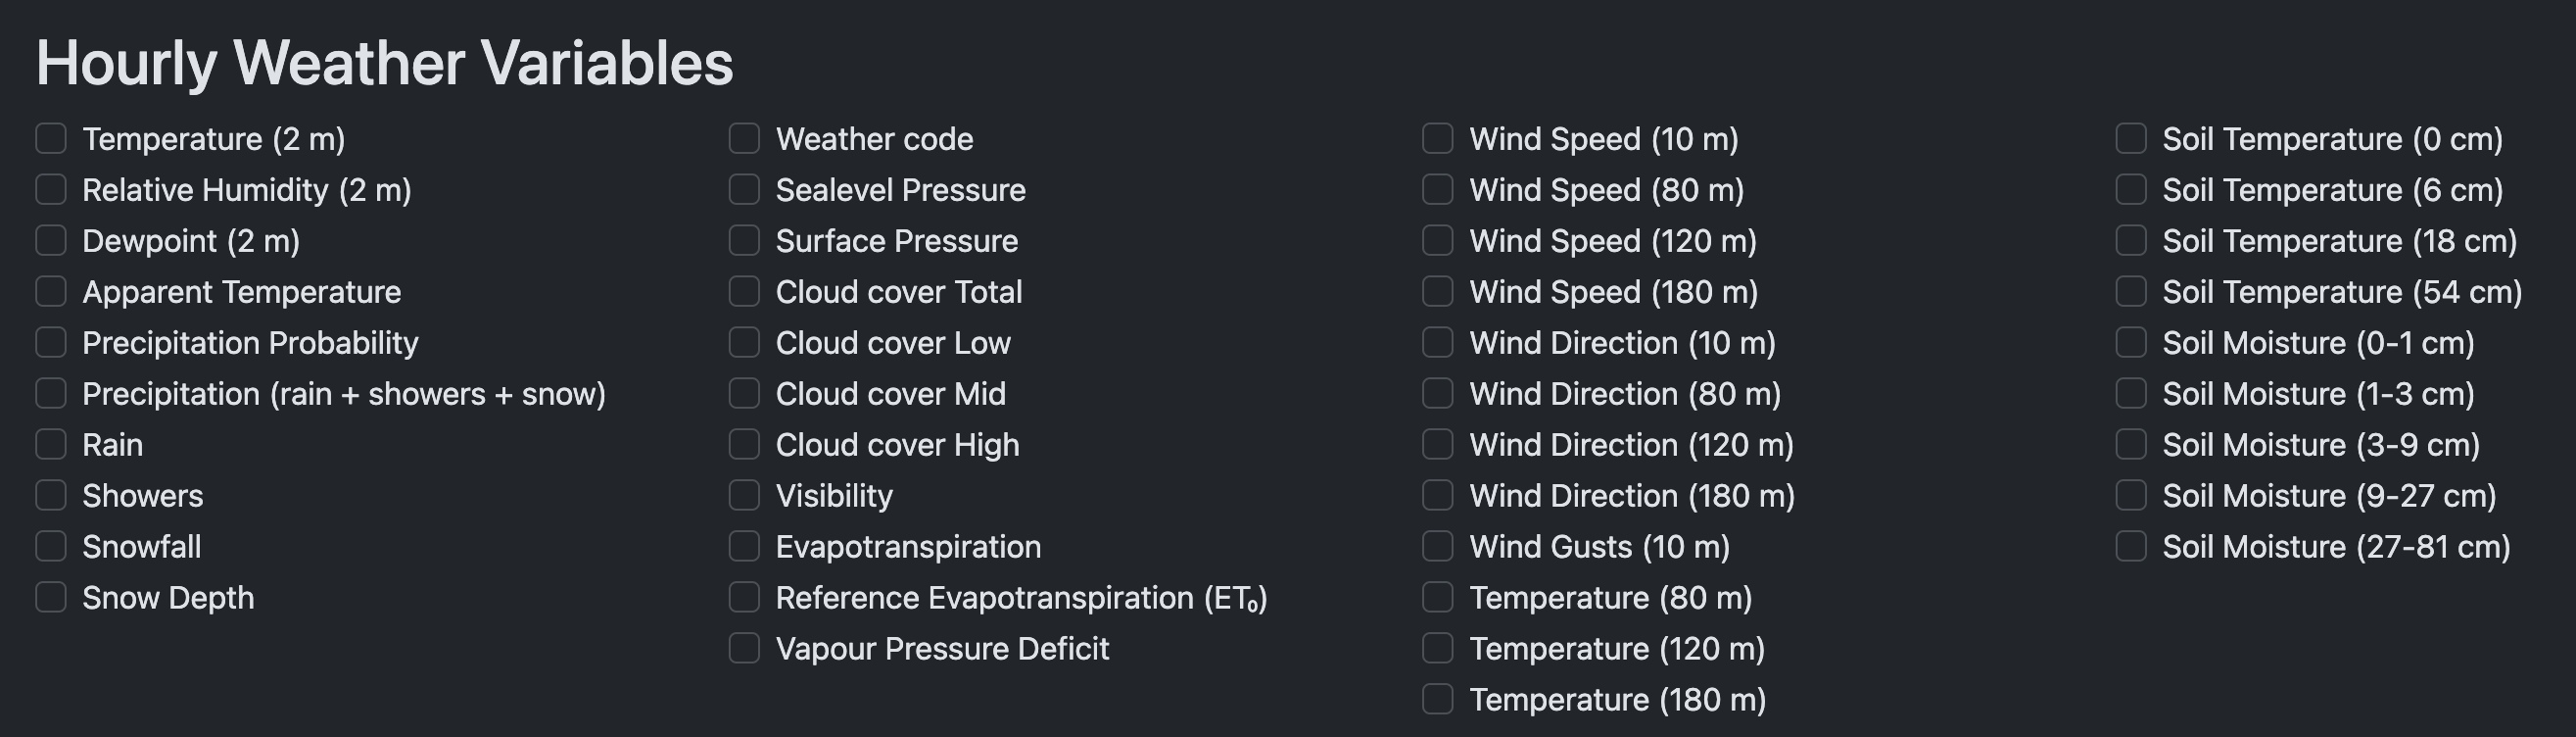
- Unselect everything in the
Hourlysection.
- In the
Dailysection, select the following:- Weather code
- Maximum Temperature (2 m)
- Minimum Temperature (2 m)
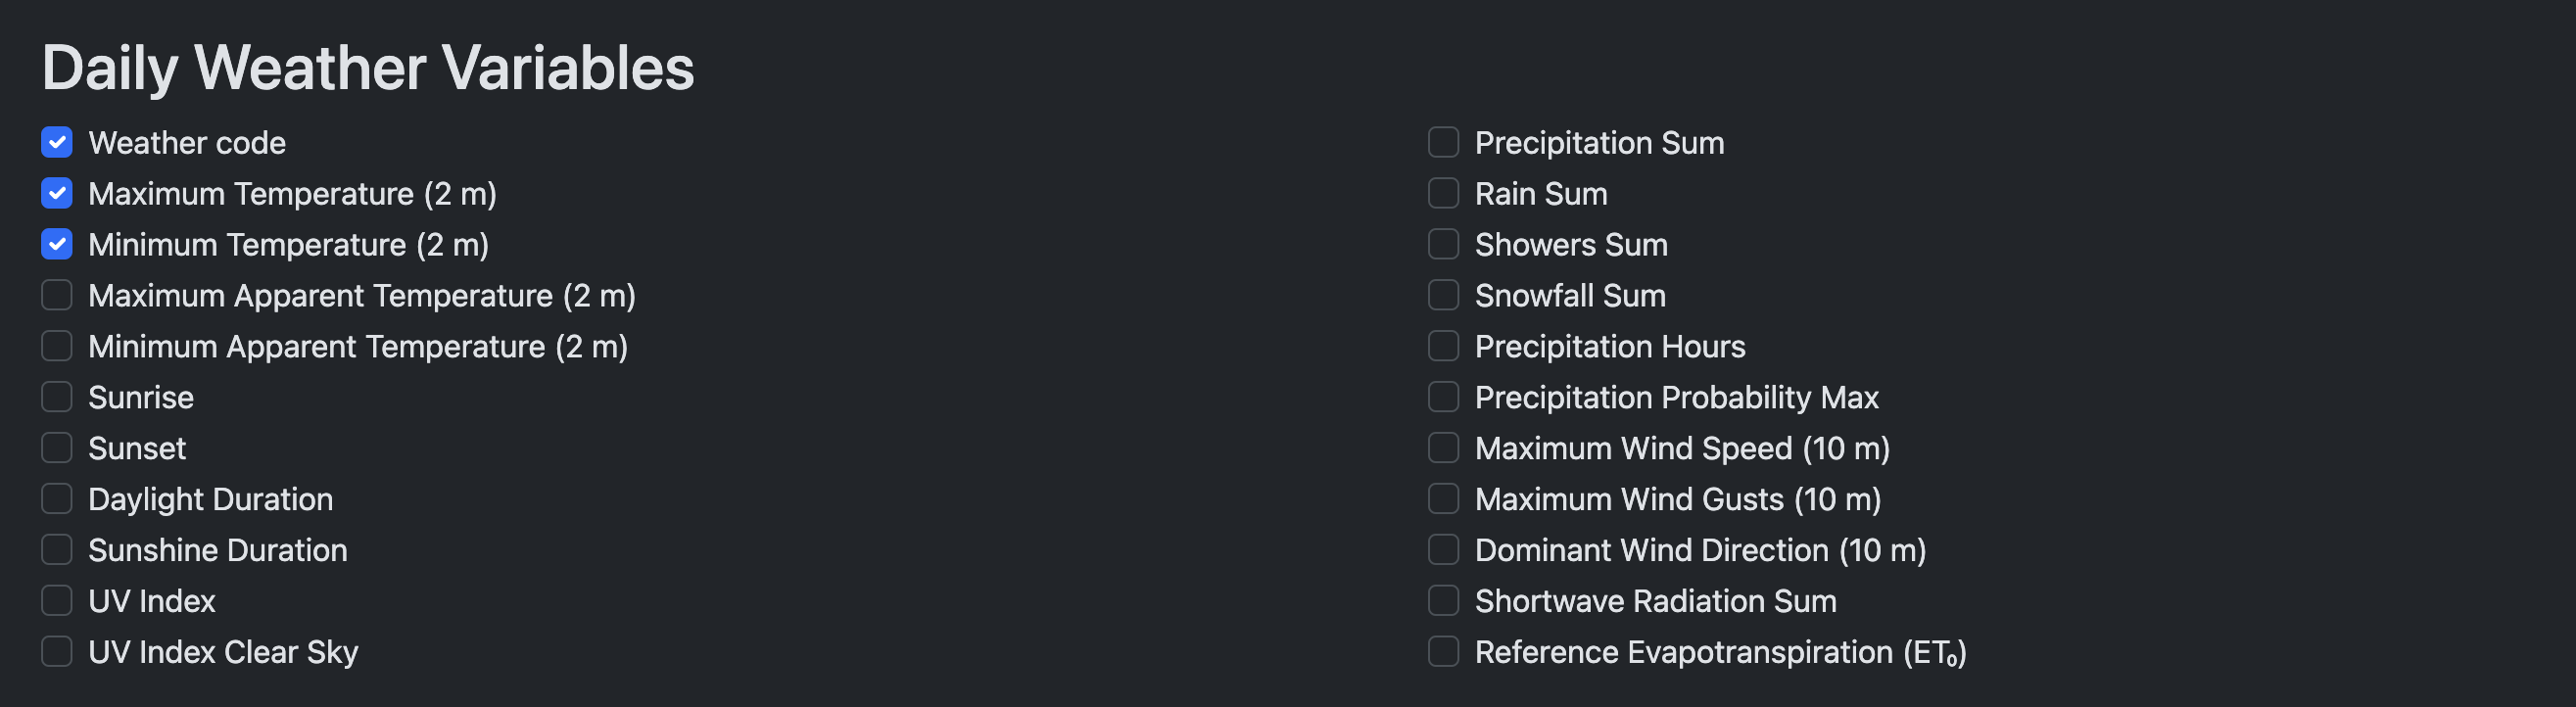
- These 3 options will give us the temperature for the day as well as the weather status.
- For
Weather codeyou can map the code to the real value by scrolling to the bottom of the Open-Meteo page.
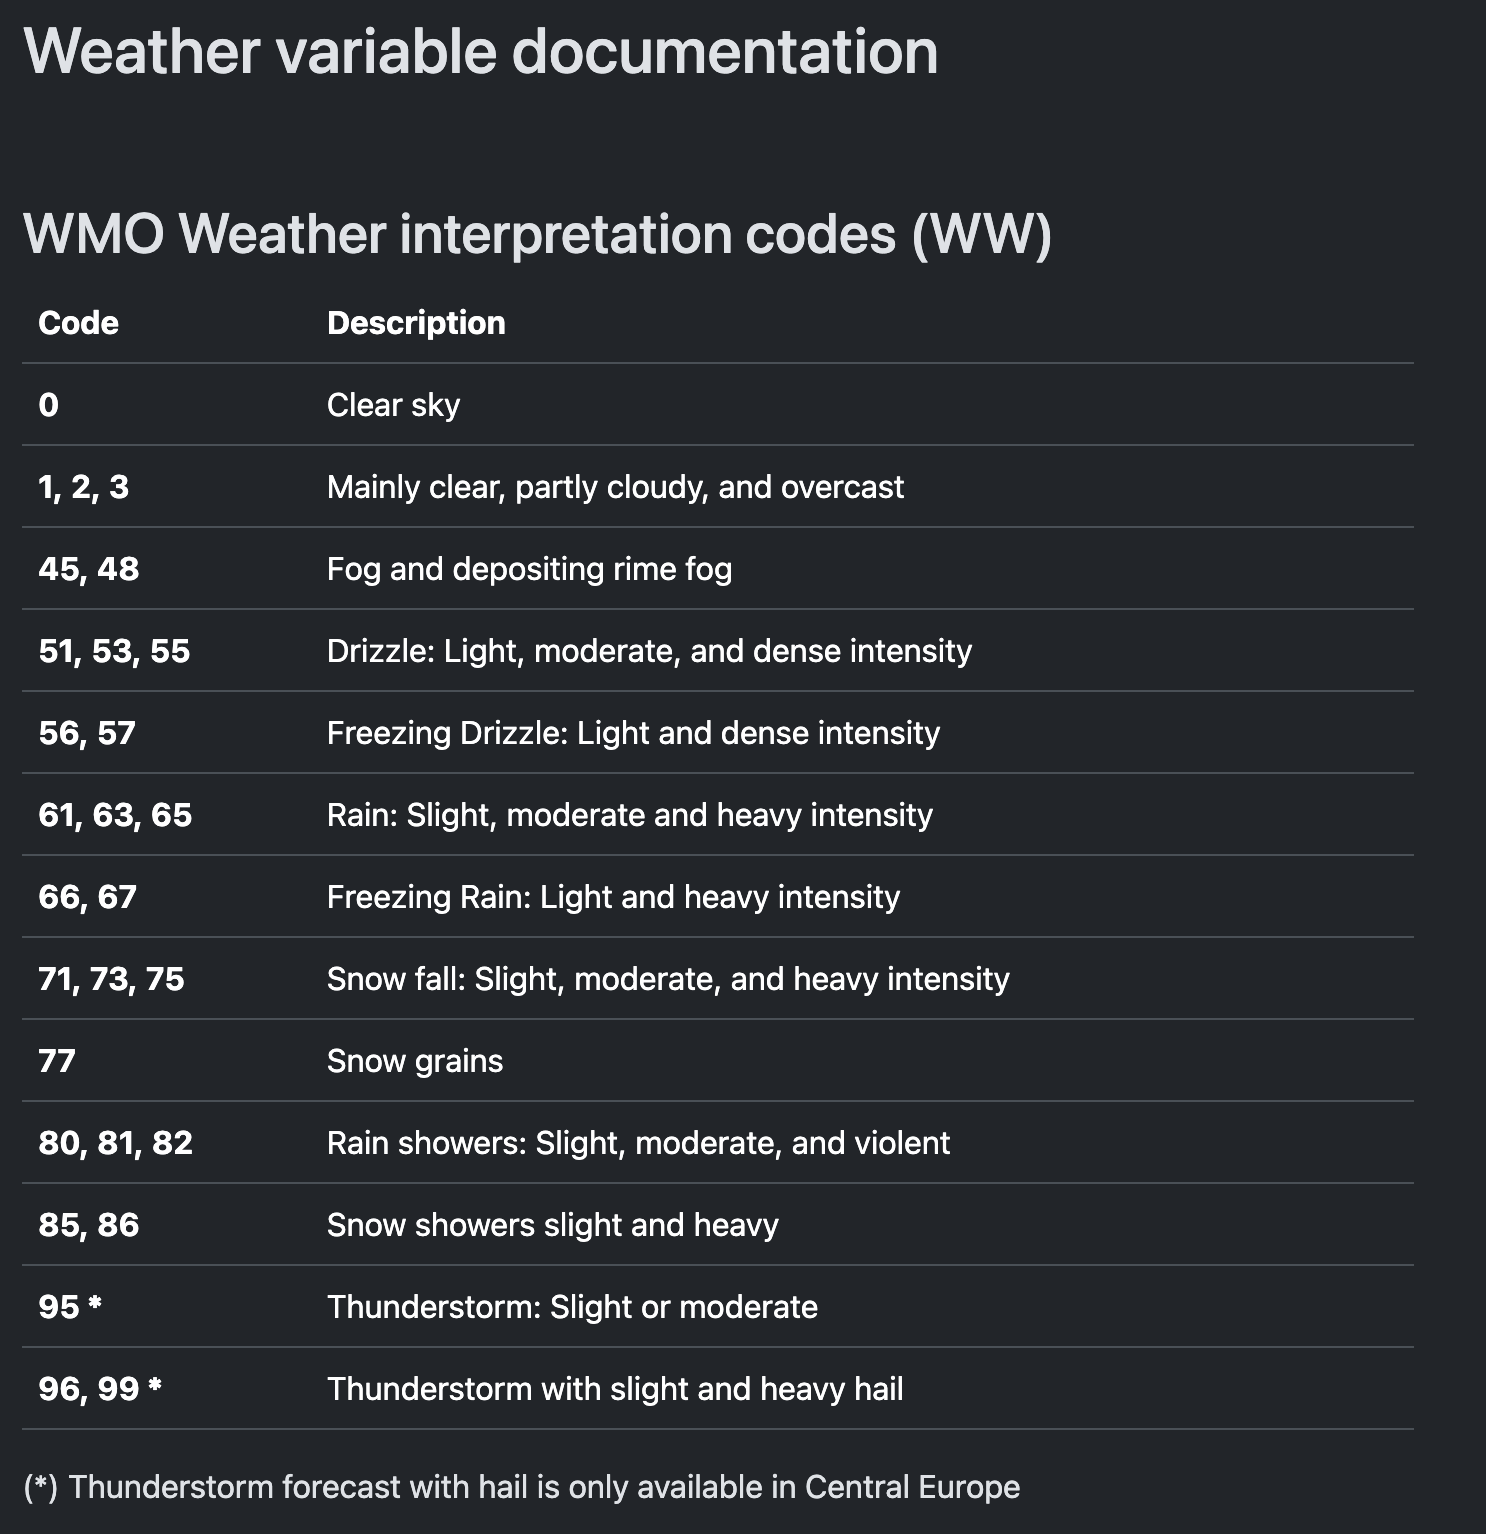
- For
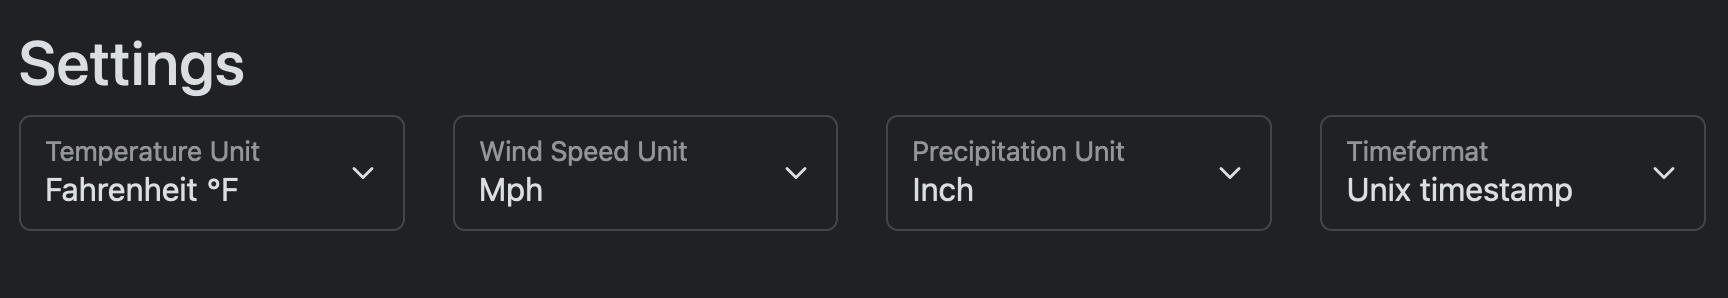
- In the
Settingssection, I am going to change theUnitsto be what I use being from the USA. If you use a different set of units, please select what you normally use.
- If you want, you can click
Reload Chartand Open-Meteo will show a chart of the data.
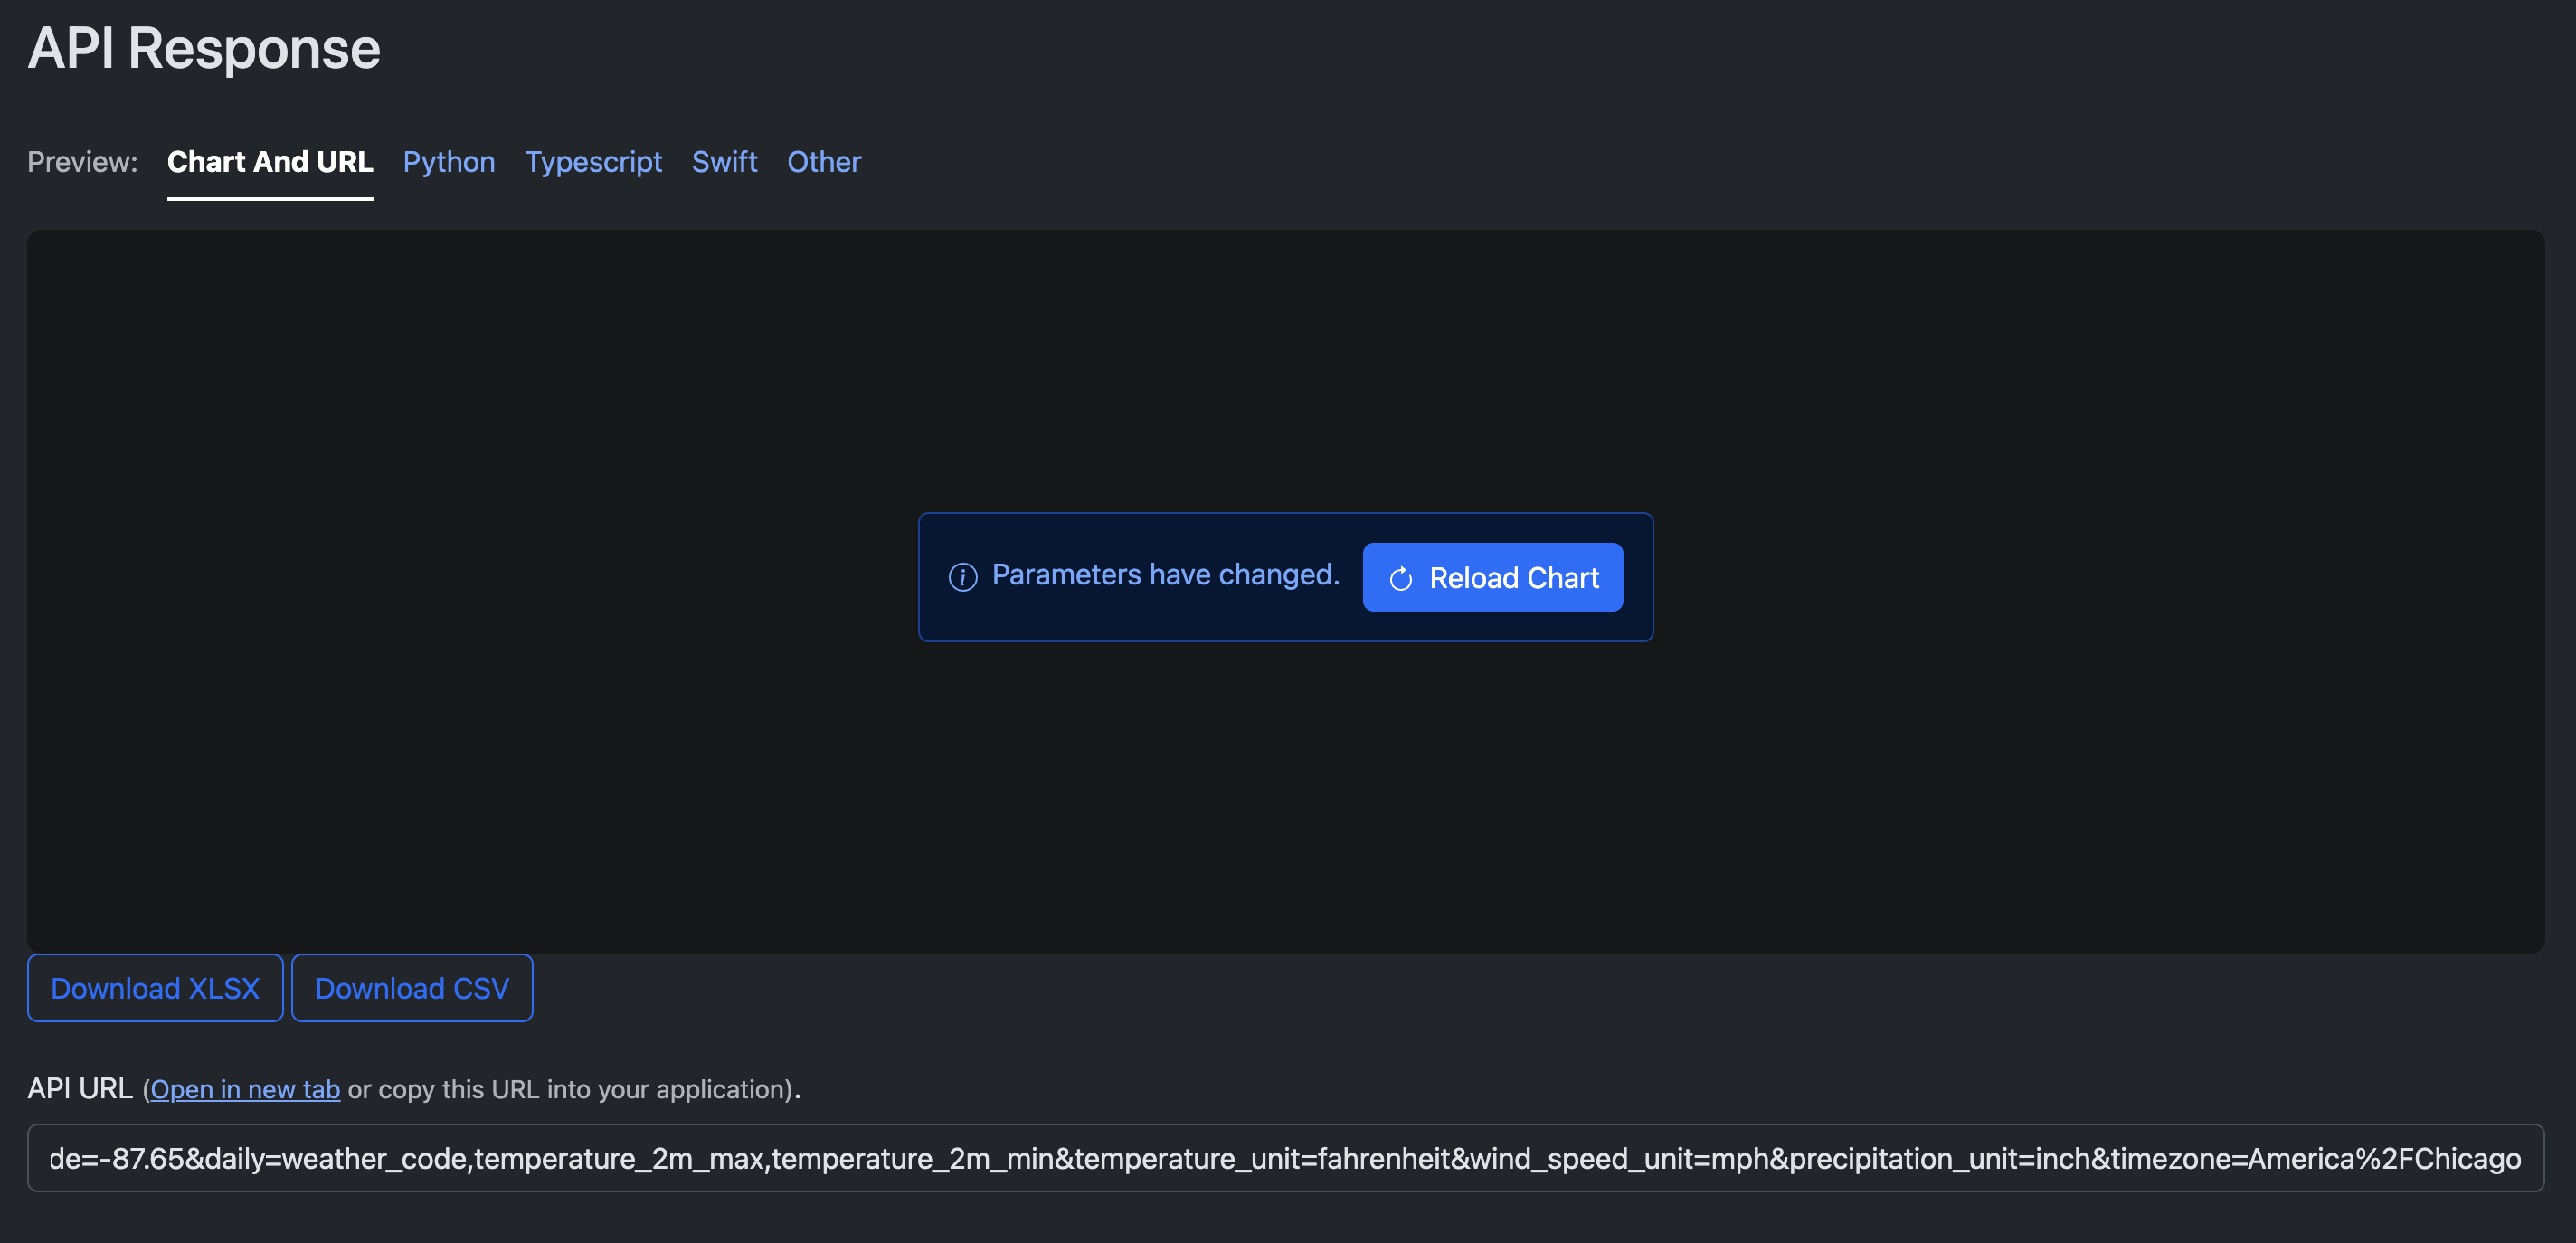
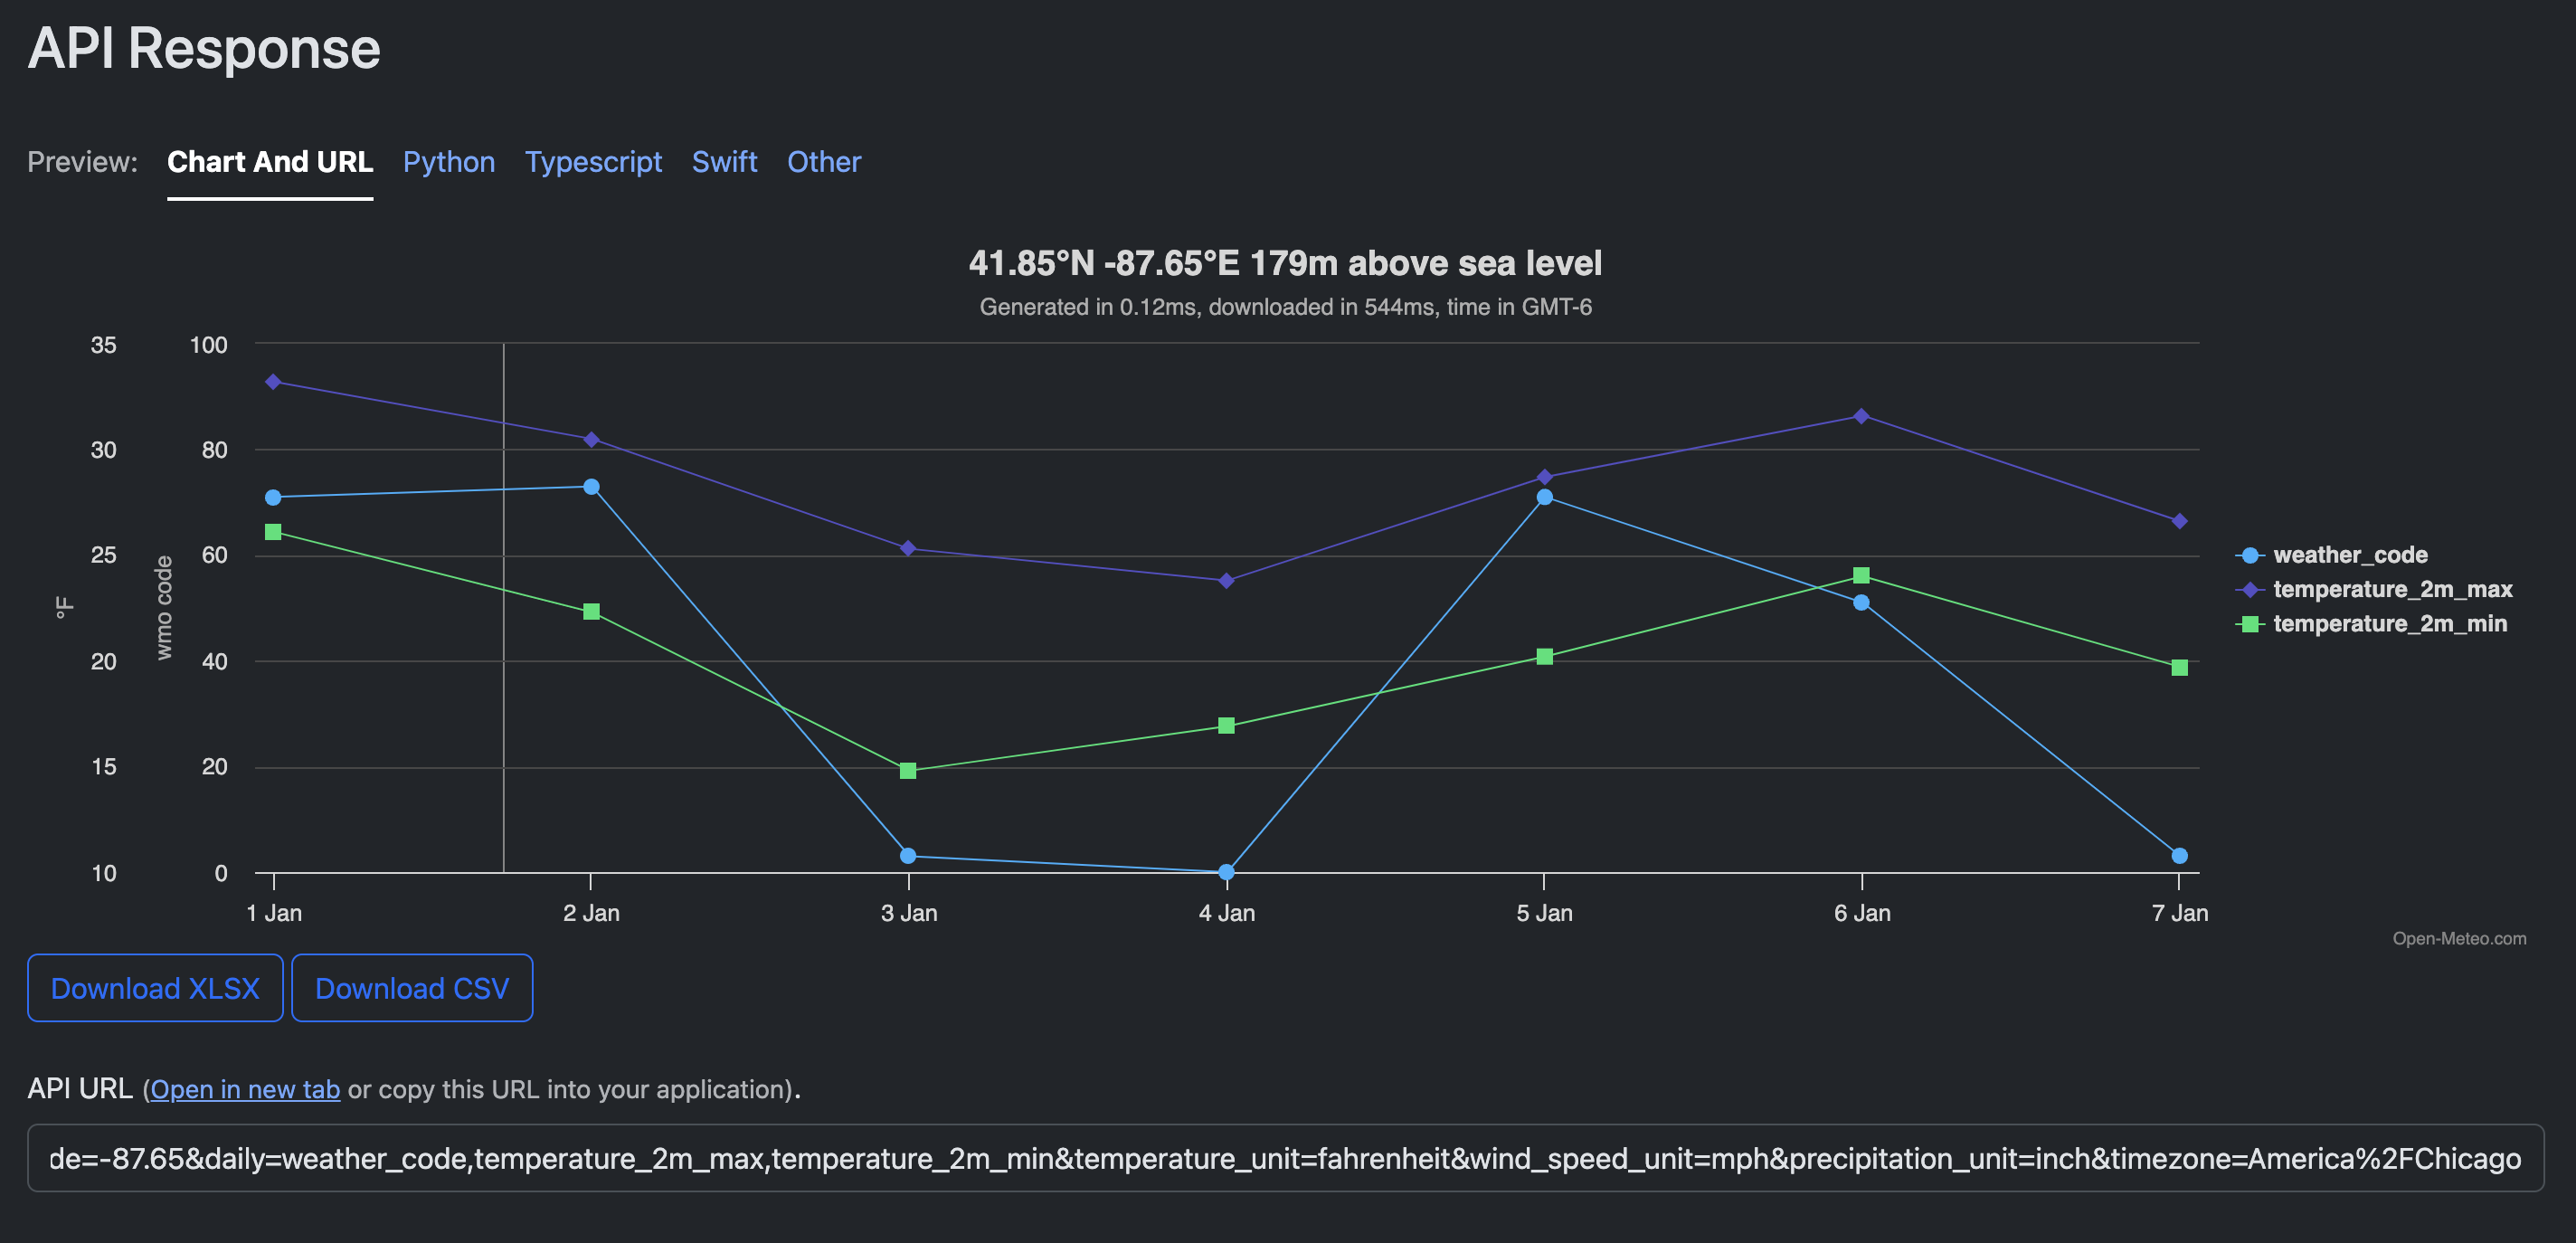
- To view the actual data in the API, below the chart there is an
Open in new tablink which will open the API in a new tab or you can just copy the URL in the box below.
- With the URL copied, add the logic for calling an API into Motion Canvas.
- You can use the module that you want but this tutorial will use
fetch - The Motion Canvas Rest API project tutorial walks you through this.
- The code to add will look the following:
const response = yield fetch('https://api.open-meteo.com/v1/forecast?latitude=41.85&longitude=-87.65&daily=weather_code,temperature_2m_max,temperature_2m_min&temperature_unit=fahrenheit&wind_speed_unit=mph&precipitation_unit=inch&timeformat=unixtime&timezone=America%2FChicago')
const data = yield response.json() - You can use the module that you want but this tutorial will use
-
Update the
CodeBlock- Update the
codesection of theCodeBlock to beJSON.stringify(data, null, 2)instead of"Hello World".
- Update the
-
Parsing API Data
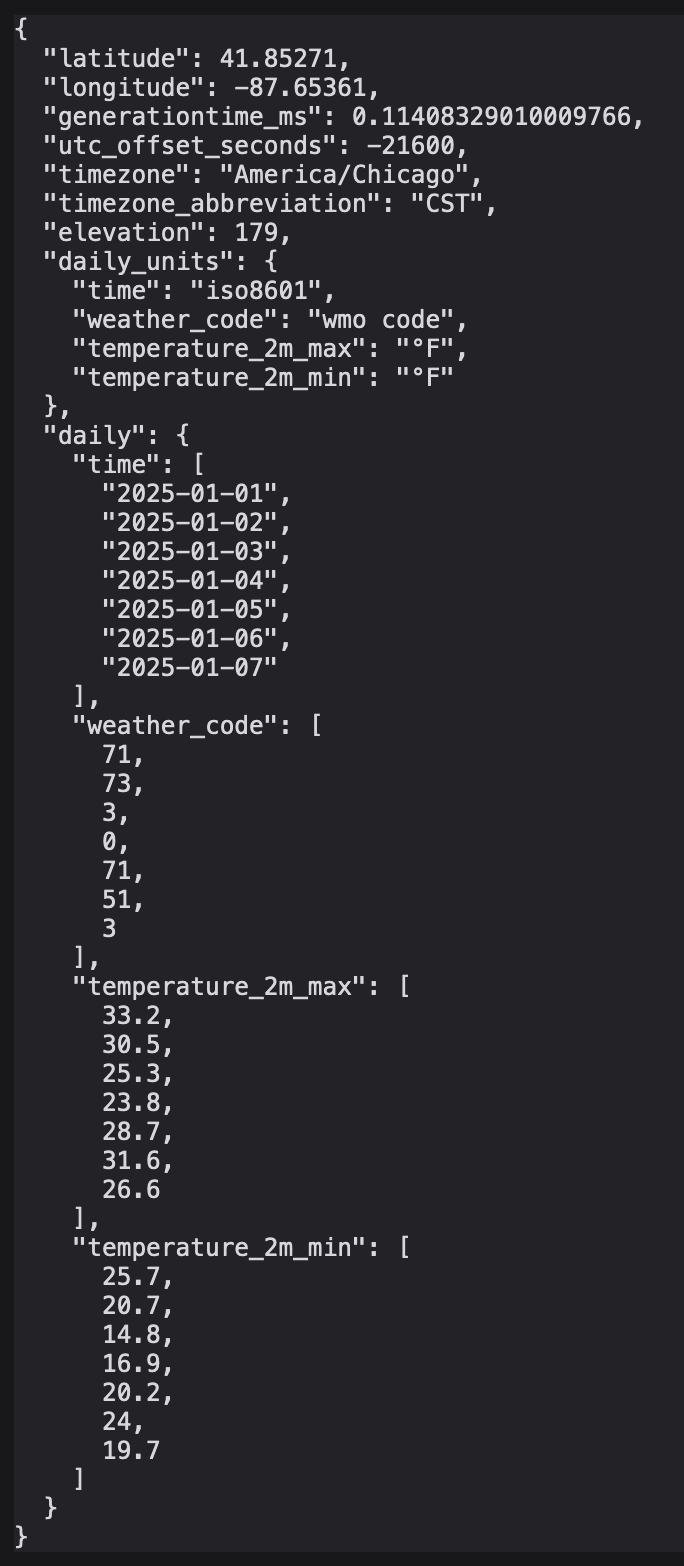
- If you looked at the JSON response of the API, you will see that it can be not as easy to read as the
dailysection just has an array for each item we want. To make it easier to understand and use, we are going to make our own object with this information that we will then use. If you want to skip this step, you will have to figure how how to ingest this data yourself.
- The first part is we want to add is our new object for storing information. Remember, for this tutorial we are using typescript so we must define our types for this object.
- From the response body, we want to collect the
date,temperature_2m_max,temperature_2m_min, andweather_code. The new object will be an array of objects; 1 object per day.
const temps: { date: Date; day: string; high: string; low: string; code: string; }[] = []- Place the above line between
const data = yield response.json()and our code block. - Under the line we just added, we can also create a mapping for each day of the week since NodeJS dates start with
0forSundayand don't give the actually names. The names in the array are abbreviated to save space in the animation.
const weekday = ["Sun","Mon","Tues","Wed","Thur","Fri","Sat"]- Below our mapping we can finally parse the API Response. We can do this by looping through each of the time elements in the API Response and placing the respective data in our new array. As part of this parsing, I am creating a new date object to help with debugging and making sure everything is correct. I am also using our mapping to get what day it is, rounding the max and min values as we want whole numbers, not decimals, and converting the weather code to a string for logic later on.
for(let i=0; i<data.daily.time.length; i++){
    temps.push({
        date: new Date(data.daily.time[i] * 1000),
        day: weekday[new Date(data.daily.time[i] * 1000).getDay()],
        high: Math.round(data.daily.temperature_2m_max[i]).toString(),
        low: Math.round(data.daily.temperature_2m_min[i]).toString(),
        code: data.daily.weather_code[i].toString()
    })
}- Update our code block to display
tempsinstead ofdata.
view.add(<Code
    fontSize={15}
    code={JSON.stringify(temps, null, 2)}
    fill={"black"}
/>); - From the response body, we want to collect the
- If you looked at the JSON response of the API, you will see that it can be not as easy to read as the
-
Adding a Header
- For the weather preview, a lot of examples have a header or bar at the top with some text. This is used to say where the weather is from or about and also more info that might be useful.
- For this tutorial, we are just going to have a header that says
7-DAY FORECASTin the upper left of the screen. - From
@motion-canvas/2dwe will be usingNode,Splineand theTxtcomponents. Please import them at the correct place at the top of the file.
import {Code, makeScene2D, Txt, Node, Spline} from '@motion-canvas/2d';- Under the
Code blockwe are going to add our header to theview. To make the shape of theSplineyou just have to play around with the shape with it positioned in the center then when it is the shape that you want, change the position to be where you want. I find that it is harder to put theSplinewhere you want first because if you need to move it, it might be more of a challenge.
view.add(
    <Node>
        <Spline
        lineWidth={4}
        fill={'#007FFF'}
        smoothness={0}
        position={[-800, -420]}
        points={[
            [250, 0],
            [350, -100],
            [-200, -100],
            [-200, 0]
        ]}
        />
        <Txt
        text={"7-DAY FORECAST"}
        x={-750}
        y={-475}
        />
    </Node>
) -
Creating a template for each day
- Next we are going to create a template for each of the 7 days that we are going to display.
- To make our code more efficient, we are going to loop through an array to create the weather preview.
- From
@motion-canvas/2dwe will be adding theRectcomponent. Please import it at the correct place at the top of the file.
import {Code, makeScene2D, Txt, Node, Spline, Rect} from '@motion-canvas/2d';- From
@motion-canvas/corewe will be adding therangecomponent. Please import it at the correct place at the top of the file.
import {range} from '@motion-canvas/core';- Underneath the logic for our header, create 7
Rectobjects with each inside of their ownNode. The entire loop should also be in its ownNode.
view.add(
    <Node>
    {
        range(7).map(i => (
        <Node>
            <Rect
            width={225}
            height={1080/2}
            x={-810 + 270 * i}
            fill="#007FFF"
            radius={10}
            />
        </Node>
        ))
    }
    </Node>
) -
Adding a gradient
- We now have 7 evenly spaced
Rectobjects but we can make it look slightly better by adding a gradient. A gradient is how we would show one color transitioning into another. - From
@motion-canvas/2dwe will be adding theGradientcomponent. Please import it at the correct place at the top of the file.
import {Code, makeScene2D, Txt, Node, Spline, Rect, Gradient} from '@motion-canvas/2d';- When creating a gradient in motion canvas, we need to define a new
Gradientobject that goes from one color to another. We also have to define from what direction and how far the gradient will go and this can be defined with the fieldsfromY,toY,fromX, andtoX. If you want to read more aboutGradient, you can read the official documentation.
warningUnfortunately, there is not good documentation on the Motion Canvas site to learn how to make a Gradient. Fortunately for you, I was able to figure it out. 😀
The best way to figure out how something works is by using the different fields in the documentation and seeing what they do.
- Putting it all together, creating a new
Gradientobject would look like:
const gradient = new Gradient({
    fromY: -160,
    toY: 160,
    stops: [
    {offset: 0, color: '#7CB9E8'},
    {offset: 1, color: '#007FFF'},
    ],
});- Place this logic inside the
makeScene2Dfunction.
PlacementI tend to place it close to the code I am working on but it could also be placed at the top of the function if you wanted it more organized.
Technically, you could also place it outside of the
makeScene2Dfunction between this function and the import it at the top of the file.- To use this gradient, update our
Rectthat we just added (From Step 11 Part 5) to have thefillbe the gradient instead.
Old Version
view.add(
    <Node>
    {
        range(7).map(i => (
        <Node>
            <Rect
            width={225}
            height={1080/2}
            x={-810 + 270 * i}
            fill="#007FFF"
            radius={10}
            />
        </Node>
        ))
    }
    </Node>
)
New Version
view.add(
    <Node>
    {
        range(7).map(i => (
        <Node>
            <Rect
            width={225}
            height={1080/2}
            x={-810 + 270 * i}
            fill={gradient}
            radius={10}
            />
        </Node>
        ))
    }
    </Node>
) - We now have 7 evenly spaced
-
Adding the day name
- To add some more style, we can add a different
Recton top of the first one, with the new gradient, for the name of the day. For the color, a darker color seems to be a nice contrast. with the gradient.
ReminderRemember to have the new
Rectafter the first one so that it sits on top of the first one.<Rect
width={225}
height={1080/10}
x={-810 + 270 * i}
y={-220}
fill="#007FFF"
radius={10}
/>- To add what day it is, we can add a new
Txtcomponent over ourRectwe just created.
LoopingBecause we are inside of a loop, we can easily get the correct information for each day without additional logic.
<Txt
text={temps[i].day}
x={-810 + 270 * i}
y={-220}
/> - To add some more style, we can add a different
-
Adding the High and Low
- To add the high and low temperatures, can do the same thing as the last step (Step 14 part 2). For extra styling, I made the high to be a larger fontSize and added some color to each of the values. By placing them lower on the main
Rectwith the gradient, we can create something that is starting to look more like a weather preview.
<Txt
fontSize={70}
text={temps[i].high}
x={-810 + 270 * i}
y={90}
fill={"white"}
/>
<Txt
text={temps[i].low}
x={-810 + 270 * i}
y={150}
fill={"#7CB9EF"}
/> - To add the high and low temperatures, can do the same thing as the last step (Step 14 part 2). For extra styling, I made the high to be a larger fontSize and added some color to each of the values. By placing them lower on the main
-
Adding the weather type
- Lastly we want to add what kind of weather we are going to have on a given day.
- Currently we have number for the weather code, let's create a mapping function to convert this code into a descriptive text.
- At the top of the function or file (below the imports), create the following mapping function using the data from the bottom of the
Open-Meteopage. For our mapping function, a switch statement can be used as an easy way to map one value to another. An IF-ELSE statement could also be used but I find a switch to be better when comparing the same variable across several values.
Weather MappingIn this tutorial, I did not create a full mapping and only the weather codes that I received. It is recommended that you do the full mapping however as the weather changes all the time and you might get weather you have mapped in the future.
For this map, I also did the shortened version of the weather text because the full version would not display how I wanted it.
Because of this, I am keeping to the groups of weather patterns and the not variations of them.
const WmoToWord = (code: string) => {
switch (code){
case "0":
return "Clear Sky"
case "3":
return "Overcast"
case "45":
return "Fog"
case "55":
return "Drizzle"
case "61":
return "Rain"
default:
return code
}
}- Now using this mapping, we can add another
Txtto our weather preview below the high and low data. To make a more stylistic look, a grey for this seems better.
<Txt
text={WmoToWord(temps[i].code)}
x={-810 + 270 * i}
y={215}
fill={"#DDDDDD"}
/> -
Adding an image for the weather
- With the same pattern as the weather description, we can create a new mapping with the images of the weather. To make is is easy, weather emojis can be used.
ImagesIf you wanted, you could also use real images or try to create different animations for each of the weather patterns and use them instead of emojis.
- Place the mapping next two the other weather mapping.
const WmoToImage = (code: string) => {
switch (code){
case "0":
return "☀️"
case "3":
return "🌤️"
case "45":
return "☁️"
case "55":
return "☔️"
case "61":
return "🌧️"
default:
return code
}
}- Now using this mapping, we can add another
Txtto our weather preview between the day text and the high data. To make a more stylistic look, a larger font for this seems better.
<Txt
fontSize={150}
text={WmoToImage(temps[i].code)}
x={-810 + 270 * i}
y={-50}
/>
At this time, we no longer need the code block that we had in the background while making the weather preview.
We can now delete the logic for our code block and remove the Code import from @motion-canvas/2d.
-
Adding a background
- Now the weather preview is completed, however we can make it better with so additional background and music.
- For the background place an image that you have in the
publicfolder. The image in this tutorial is calledwinter.jpg
CopyrightThe image in this tutorial is not owned by me as it was a random image found online. Because I do not own the Copyright for this image, I can not share it in this tutorial.
- At the top of the page, add
Imgto the imports for@motion-canvas/2d
import {makeScene2D, Txt, Node, Spline, Rect, Gradient, Img} from '@motion-canvas/2d';- Below the existing imports, import the image:
import winter from '../../public/winter.jpg?url';- Above all of the other
view.addwe can add our image to the scene:
view.add(
<Img
scale={3.5}
src={winter}
/>
);Image ScaleMy image was smaller then the resolution of the scene (1920 x 1080) so I needed to scale the image until it took over the entire scene.
-
Adding some music
- To make this animation even better let's add some music to make it sound more like the Weather Channel.
CopyrightThe audio in this tutorial is not owned by me as it was a random audio clip found online. Because I do not own the Copyright for this audio, I can not share it in this tutorial.
For protection from youtube copyright, the audio played will only be 5 seconds long and I am talking over it in the tutorial video.
- Place our music that we have in our
publicfolder along side our background image. The audio in this tutorial is calledmusic.mp3. - In our
./src/project.tsfile, add a newaudioimport underweatherand also add the audio to our project. - The entire file now looks like the following:
import {makeProject} from '@motion-canvas/core';
import weather from './scenes/weather?scene';
import audio from '../public/music.mp3?url'
export default makeProject({
scenes: [weather],
audio: audio
});Audio ClipsThe current version of Motion Canvas only supports 1 audio track and the animation rendering ends when either the audio is done or the animations complete, whichever one comes first.
Because of this, we need to add a
waitForat the end of themakeScene2Dfunction to only play the audio since there are no other animations.In a future release, Motion Canvas will support multiple audio clips which you can learn more about by reading this pull request: feat: programmable sounds #1082.
- As mentioned in the tip above, we need to add a
waitForto our logic. - At the top of the page, add
waitForto the imports for@motion-canvas/core
import {range, waitFor} from '@motion-canvas/core';- At the bottom of the
makeScene2Dfunction add ourwaitForfor5 seconds. Remember you can have the seconds be for how long you want it to be but no more then the length of the audio track.
yield* waitFor(5) -
End Results
import {makeScene2D, Txt, Node, Spline, Rect, Gradient, Img} from '@motion-canvas/2d';
import {range, waitFor} from '@motion-canvas/core';
import winter from '../../public/winter.jpg?url';
export default makeScene2D(function* (view) {
const response = yield fetch('https://api.open-meteo.com/v1/forecast?latitude=41.85&longitude=-87.65&daily=weather_code,temperature_2m_max,temperature_2m_min&temperature_unit=fahrenheit&wind_speed_unit=mph&precipitation_unit=inch&timeformat=unixtime&timezone=America%2FChicago')
const data = yield response.json()
const temps: { date: Date; day: string; high: any; low: any; code: any; }[] = []
const weekday = ["Sun","Mon","Tues","Wed","Thur","Fri","Sat"]
const WmoToWord = (code: string) => {
switch (code){
case "0":
return "Clear Sky"
case "3":
return "Overcast"
case "45":
return "Fog"
case "55":
return "Drizzle"
case "61":
return "Rain"
default:
return code
}
}
const WmoToImage = (code: string) => {
switch (code){
case "0":
return "☀️"
case "3":
return "🌤️"
case "45":
return "☁️"
case "55":
return "☔️"
case "61":
return "🌧️"
default:
return code
}
}
for(let i=0; i<data.daily.time.length; i++){
temps.push({
date: new Date(data.daily.time[i]),
day: weekday[new Date(data.daily.time[i]).getDay()],
high: Math.round(data.daily.temperature_2m_max[i]).toString(),
low: Math.round(data.daily.temperature_2m_min[i]).toString(),
code: data.daily.weather_code[i].toString()
})
}
view.add(<Img
scale={3.5}
src={winter}
/>
);
// Heading
view.add(
<Node>
<Spline
lineWidth={4}
fill={'#007FFF'}
smoothness={0}
position={[-800, -420]}
points={[
[250, 0],
[350, -100],
[-200, -100],
[-200, 0]
]}
/>
<Txt
text={"7-DAY FORECAST"}
x={-750}
y={-475}
/>
</Node>
)
// Base Template
const gradient = new Gradient({
fromY: -160,
toY: 160,
stops: [
{offset: 0, color: '#7CB9E8'},
{offset: 1, color: '#007FFF'},
],
});
view.add(
<Node>
{
range(7).map(i => (
<Node>
<Rect
width={225}
height={1080/2}
x={-810 + 270 * i}
fill={gradient}
radius={10}
/>
<Rect
    width={225}
    height={1080/10}
    x={-810 + 270 * i}
    y={-220}
    fill="#007FFF"
    radius={10}
/>
<Txt
    text={temps[i].day}
    x={-810 + 270 * i}
    y={-220}
/>
<Txt
    fontSize={70}
    text={temps[i].high}
    x={-810 + 270 * i}
    y={90}
    fill={"white"}
/>
<Txt
    text={temps[i].low}
    x={-810 + 270 * i}
    y={150}
    fill={"#7CB9EF"}
/>
<Txt
    text={WmoToWord(temps[i].code)}
    x={-810 + 270 * i}
    y={215}
    fill={"#DDDDDD"}
/>
<Txt
    fontSize={150}
    text={WmoToImage(temps[i].code)}
    x={-810 + 270 * i}
    y={-50}
/>
</Node>
))
}
</Node>
)
yield* waitFor(5)
}); -
Bonus: Leaning about the API options
- If we look again at the API call it is:
https://api.open-meteo.com/v1/forecast?latitude=41.85&longitude=-87.65&daily=weather_code,temperature_2m_max,temperature_2m_min&temperature_unit=fahrenheit&wind_speed_unit=mph&precipitation_unit=inch&timeformat=unixtime&timezone=America%2FChicago - Formatting it a little to break it down gets us:
https://api.open-meteo.com/v1/forecast?
    latitude=41.85 &
    longitude=-87.65 &
    daily=weather_code,temperature_2m_max,temperature_2m_min &
    temperature_unit=fahrenheit &
    wind_speed_unit=mph &
    precipitation_unit=inch &
    timeformat=unixtime &
timezone=America%2FChicago- We can see that the options we selected in the UI at the beginning are presented here. With this information, we can automate switching between different areas just by dynamically updating the latitude and longitude and calling the API again.
- Review the rest of the Open-Meteo page for how the API is used.
- With this information, you should be able to put what we created together in one or more functions and cycle through different cities.
- If we look again at the API call it is:
You have now created a working Rest API call with Motion Canvas. In the next project, we will expand upon these concepts.